Has The Baltic Index Gone Dry?
By Greg Peel
The Baltic Dry Index is an index of freight rates charged by the owners of the massive bulk carriers which traverse the world's oceans with “dry” cargoes such as coal, iron ore and wheat. The ships include the Panamax, which carries coal from eastern Australia and the larger Capesize, which carries iron ore from Western Australia and Brazil.
By end-2010 there were 1813 Panamaxes in operation with a net capacity of around 136mt and 1172 Capesizes with a net capacity of around 211mt.
As one might appreciate, ship builders don't just knock up a Capesize in a day or two. The lag in orders for new ships placed by owners and their ultimate delivery means that ship owners need to look into the future to assess the global demand for bulk minerals and grains and subsequent need for transport before they rush into ordering. Similar decisions need to be made as to whether now is a good time to scrap older vessels ready to be replaced by new ones.
It is a competitive market which at any time can see an undersupply of vessels when demand is strong and an oversupply when demand is weak. As one might appreciate, the past few years of boom, bust and boom again in commodity demand will have had ship owners and builders pulling their hair out. Freight charges are not fixed – they are fluid and operate much like any spot price market operates. The risk is that weak demand sees freight rates fall below ship operating cost on the one side, or that strong demand pushes freight rates to uneconomical levels for commodity buyers on the other.
But what the ship owners' dilemma does mean is that the index of freight rates has in past years become a rather reliable lead indicator of commodities prices. Prices rise only after demand rises, and traders of bulk goods need to book in their ships early to secure transport on orders. This means that typically freight rates rise first as the orders flow in, and then commodity prices begin to rise in recognition of increased demand.
Prior to last year, the BDI was running ahead of iron ore and coal contract prices which only step-jumped once a year, so it has proven quite a handy lead indicator of mineral price movements with a long lead time. More recently bulk material contract pricing has moved to quarterly contracts and spot deliveries have increased significantly.
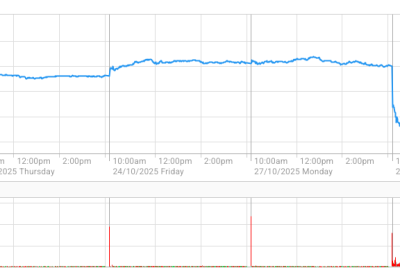
The following graph compares commodity prices, in the form of the CRB commodity price index, with the BDI. As one can note from 2006 to 2009, the BDI lead the CRB quite reliably. The relationship is close but not quite as close for the Dow Jones Industrial Average, used here as the proxy for share price movements. But the 30-stock Dow is simply not a good proxy for commodity-based share price movements. The S&P 500 would have been more relevant. And even more so the ASX 200.
But while the BDI's lead indicator role works well to end-2009 as the graph shows, it completely breaks down in 2010. This is a disappointment for traders and analysts who have come to rely on the predictive value of the BDI. What's gone wrong?
Well for starters, the aforementioned shift in coal and iron ore pricing to at least quarterly contracts, with many more deliveries being made at spot, will have dampened the BDI's predictive power. However, the real reason is that one must look at both sides of the equation – the demand for commodities on one side and the supply of ships on the the other. In short, ship building has run amok, and given construction lag times we can look right back to the 2008 commodity boom as the genesis.
The above-mentioned “head count” of Panamaxes and Capesizes represent a twelve month increase of 12% for Panamaxes and 17% for Capesizes. Nor are these vessels generic in capacity, such that not only are there more ships on the water the capacity of the bigger ships has been rising. Thus the increased ship numbers actually translate to only an 11% capacity increase for Panamaxes but a 22% increase for Capesizes, according to data prepared by Barclays Capital.
While a number of ships do get scrapped each year, as one can imagine they aren't scrapped five minutes after they're delivered. So an increased ocean fleet will remain an increased ocean fleet for some time.
As the above graph shows, the CRB index spent 2009-10 returning to levels of the 2008 boom but while the BDI might have picked the turn, it fizzled and waned for the rest of the year. Once upon a time that suggested commodity prices might also be about to turn but the same trend has continued into 2011. Commodity prices keep rising and freight rates keep plunging.
There have been other extenuating circumstances. Late last year South Africa suffered a significant coal supply delay due to a derailment, and then was hit by floods. A tropical storm then hit Western Australian and curbed iron ore exports, before the big one came along in Queensland this year and temporarily shut-down 70% of the state's coal mines. Obviously these events disrupted bulk mineral trade, and hence idle ships led to lower freight rates.
Barclays therefore sees some room for the BDI to bounce a bit, but the reality is the current oversupply of ships means the bounce will only be mild even if the CRB rises ever upward. To put things into perspective, nineteen new Capesizes hit the water in the second half of 2010 compared to twelve in the same period in 2009 and six in 2008. And the story gets worse for ship owners.
Brazil's world-leading iron ore producer Vale has designed and ordered a new ship – the Chinamax. This 400,000dwt leviathan will transport iron ore to China and blow the paltry Capesizes and Panamax runabouts out of the water. It will be like Lasers taking on Wild Oats XI. And there won't be just one. The first Chinamax is due in mid-2011 but by end-2013, thirty are planned to hit the water.
It must be a ship owner's nightmare. But for stock market traders, investors and analysts, it likely means the BDI lead indicator is dead forever. Now we'll just have to figure it out for ourselves.
See also "Bleak Prospects For Global Shipping", published on 23rd December, 2010.
Technical limitations
If you are reading this story through a third party distribution channel and you cannot see charts included, we apologise, but technical limitations are to blame.
FN Arena is building the future of financial news reporting at www.fnarena.com . Our daily news reports can be trialed at no cost and with no obligations. Simply sign up and get a feel for what we are trying to achieve.
Subscribers and trialists should read our terms and conditions, available on the website.
All material published by FN Arena is the copyright of the publisher, unless otherwise stated. Reproduction in whole or in part is not permitted without written permission of the publisher.


