The Coalition's income tax cuts will help the rich more, but in a decade everyone pays more anyway

Does the Coalition’s tax plan favour high earners over those with lower incomes?
Depending whom you listen to, the tax cuts, unveiled in last month’s federal budget, lead to either a flatter, more regressive tax system under which low-income earners will be even worse off relative to high earners, or the opposite, with a progressive outcome. It can’t be both.
While there are tax cuts proposed from July this year, the most substantial cuts are planned for 2022-23 and then 2024-25. As this is several years away, it becomes tricky to analyse their likely impact.
The main issue is wage inflation, which in turn leads to “bracket creep”. We tend to think about the change in terms of what it means for today’s incomes, but that’s not realistic. An annual income today of A$80,000 will be around A$110,000 by 2027-28 if the government’s wage projections prove to be accurate.
Using our model of the Australian tax and welfare system, PolicyMod, we projected the incomes of each person in the 20,000 families in the underlying model survey data (the Australian Bureau of Statistics’ Survey of Income and Housing 2015-16).
We did this for each year until 2028-29, using the federal budget’s wage assumptions. We then used this to forecast the outcome of the proposed tax cuts, and compared it with the effects of maintaining current tax rates.
Our results are remarkably similar to the forecasts of Treasurer Scott Morrison. He has projected a total tax cut between 2018-19 and 2028-29 of A$143 billion, whereas our model puts this figure at A$140 billion.
Whose tax is being cut?
Who will actually receive these tax cuts, and will they really benefit? Our modelling shows around 50% of the adult population pays income tax in a given year. So clearly the benefit goes to the top half of the taxable income distribution.
What’s more, if the tax cuts are only returning bracket creep for many taxpayers, then they are not really tax “benefits”, because they will not make those people better off in real terms.
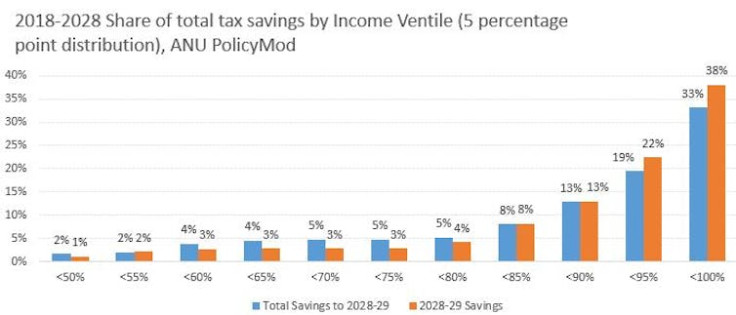
This is clearly shown in the chart below, where the bottom 50% of taxable income individuals will have a negligible share of tax savings. Around 33% of total savings between 2018-19 and 2028-29 go to people in the top 5% of incomes. In 2028-29 it is 38%.

If this were the end of the story, we might conclude that the tax cuts are grossly unfair. But it’s not quite as simple as that, because people with the highest taxable incomes are not necessarily the “wealthiest” people.
A more reasonable test considers whether the income tax cuts are real or “imagined”. If they are real, average tax rates should be lower. The fairness of the tax cuts can then be judged by the share of the tax burden across the income distribution.
If high earners are paying a larger share of tax than low and middle earners, then we have a more progressive tax system. A less progressive system, in contrast, is a flatter system - although not necessarily a totally flat income tax rate.
But determining whether the proposals are progressive or regressive still doesn’t fully answer the question of whether they are “fair”.
Fair tax hikes for all?
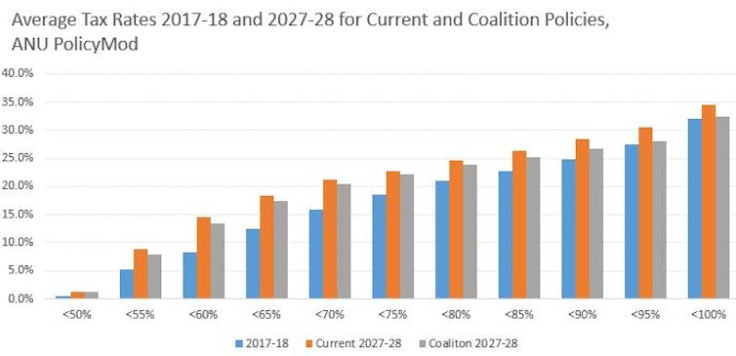
The chart below shows that tax rates will increase for all income groups, although they will rise more slowly if the Coalition’s tax plan is delivered. Crucially, higher earners will feel this difference most keenly. By 2027-28, the top 5% of earners average tax rate will be 2.1 percentage points lower than under the current regime, whereas for the bottom 50% the difference is just 0.2%.

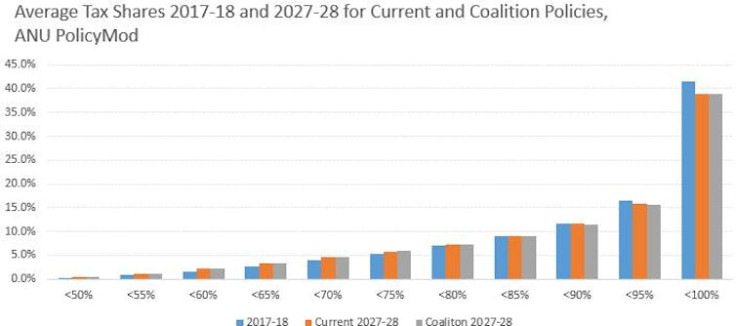
Another way of looking at progressivity is to consider the share of tax paid. The chart below shows that under the current policy trajectory, higher-income groups pay a lower share of tax in future years compared with 2017-18. This occurs naturally due to bracket creep, which tends to impact low- and middle-income people more than those with very high incomes.
In the current financial year the top 10% of earners pay 58% of personal income tax. By 2027-28 this is projected to fall to 54.8% if the tax regime remains unchanged. Under the Coalition’s tax plan it is only marginally lower still, at 54.3%.

Anyway, it is purely hypothetical to extrapolate the current tax regime as far ahead as 2027-28. It is highly likely that future governments will change the tax code for a range of reasons, including overcoming bracket creep.
Note also that some “low-income” people may live in high-income households. However, our earlier analysis looking at households rather than individual earners also suggests that the Coalition’s tax proposal is marginally less progressive than the current system.
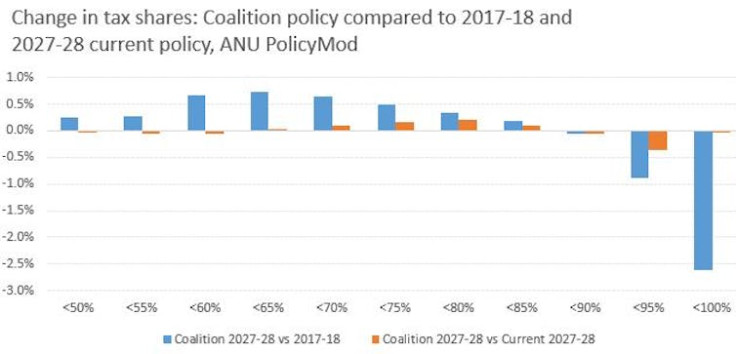
The chart below shows that the Coalition’s tax policy will have only a limited impact on the tax shares at different income levels by 2027-28. Perhaps a more relevant comparison is with the current tax shares for 2017-18, where a clearer pattern emerges of low- and middle-income earners paying a larger share of taxation.

The upshot is that the Coalition’s policy only partly overcomes bracket creep, with taxes still set to increase overall in the long term. The proposed policy does slightly more to overcome bracket creep for higher-income individuals. But it also locks in a higher tax share for those on low and middle incomes, and a lower share of the tax burden for higher earners.
On that basis, the proposals will lead to a slightly less progressive income tax regime than the one we currently have. But it will still be a long way short of a flat tax, and pretty much everyone looks set to be paying more income tax a decade from now.
Ben Phillips, Associate Professor, Centre for Social Research and Methods, Australian National University and Matthew Gray, Director, ANU Centre for Social Research and Methods, Australian National University
This article was originally published on The Conversation. Read the original article.


